Yahoo Finance Warehouse
Once upon a time I did a side project where I visualized some financial data from yahoo finance after importing it to my own database using airbyte and then modeling the data how I’d like it using dbt.
I wrote a blog post about it on my website a while ago, but I think I didn’t manage to migrate the backend correctly from heroku to fly.io and now the data is gone gone.
Luckily I stored it on my computer so I will just copy and paste it below!
Introduction
As a part of a hobby project with a friend where we need stonk data, we’ve created a git repository for fetching, storing and visualizing data from yahoo finance with some interesting tools.
One of the purposes of this project is to set up one’s own stock portfolio monitoring tool where much of the day-to-day noise of the market and happenings in the world is removed.
To get everything in this project up and running is quite a bit of hassle, so this post attempts to guide you through setting everything up from scratch. I will assume you are using a fresh install of Ubuntu and have some knowledge of the terminal (help).
Most of the information here is available in the repository’s readme, however this guide will be more visual including some screenshots. If you have any issues getting things to work, please post them to the issues section of the repository. If the issue is specific to one of the tools, other options are dbt slack, airbyte slack and lightdash slack.
This post includes limited information about the concepts in Airbyte, to learn more about those check out the Airbyte docs.
Table of contents
- Prerequisites
- Setup of warehouse database
- Fetch data with Airbyte
- Model the data inside of the warehouse with dbt
- Visualize data with Lightdash
Prerequisites
If docker stuff is not working, see this readme for help with installing a new version of docker.
Clone the git repo
git clone https://github.com/Travbula/yahoo-finance-warehouse.git
Setup of warehouse database
Open the database folder inside of the repo:
cd yahoo-finance-warehouse/database
Start the database
docker-compose up -d
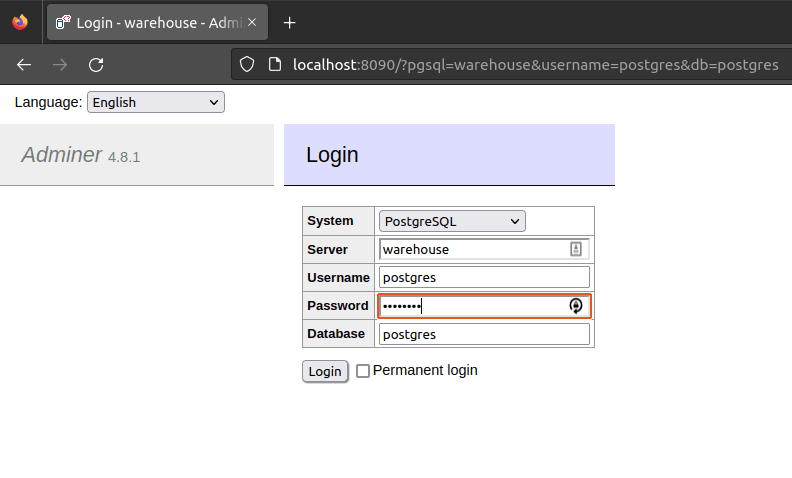
Connect to the database with some tool, e.g. adminer at localhost:8090 and login with the default information:
- Server: warehouse
- Username: postgres
- Password: postgres
- Database: postgres
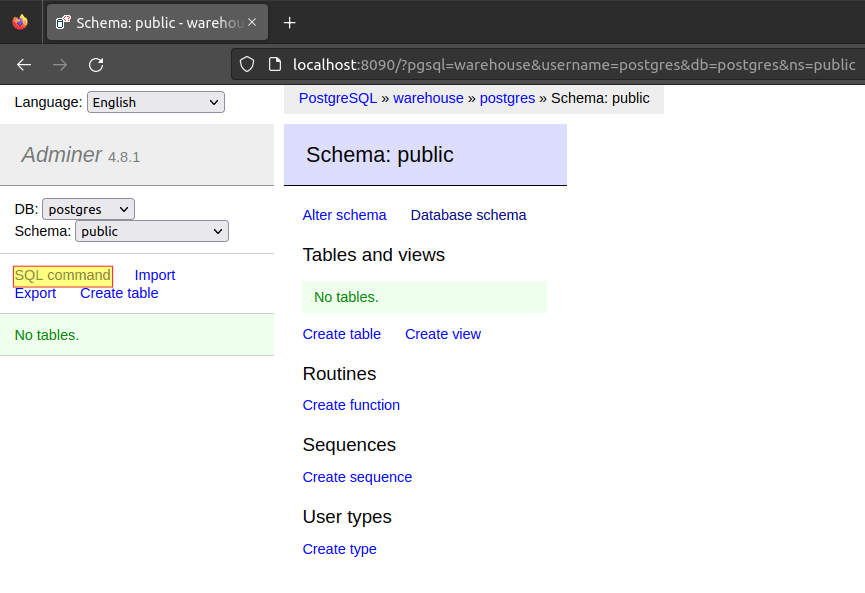
Then open the sql command panel.
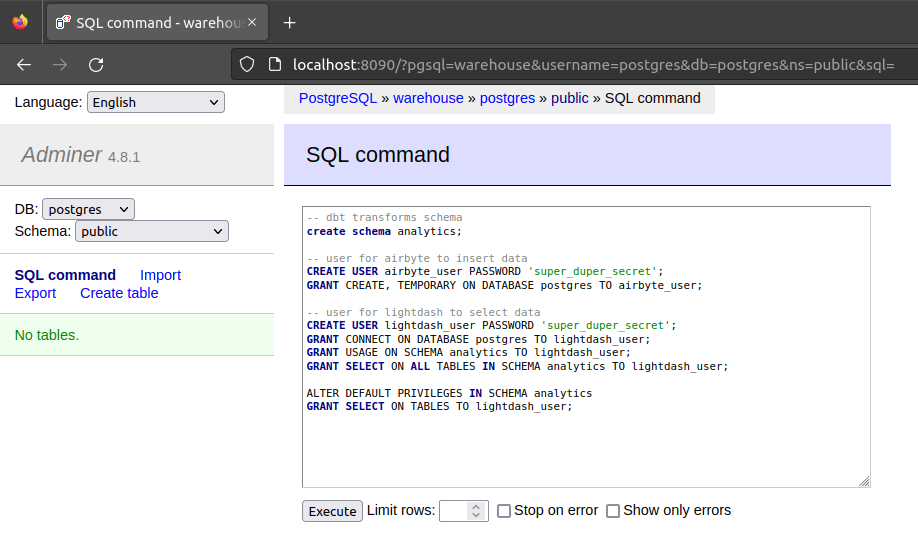
In the sql command panel, run the sql commands inside of the create_db.sql file in the database folder in the repo.
After running this, you should see a bunch of green text signifying the commands were successful.
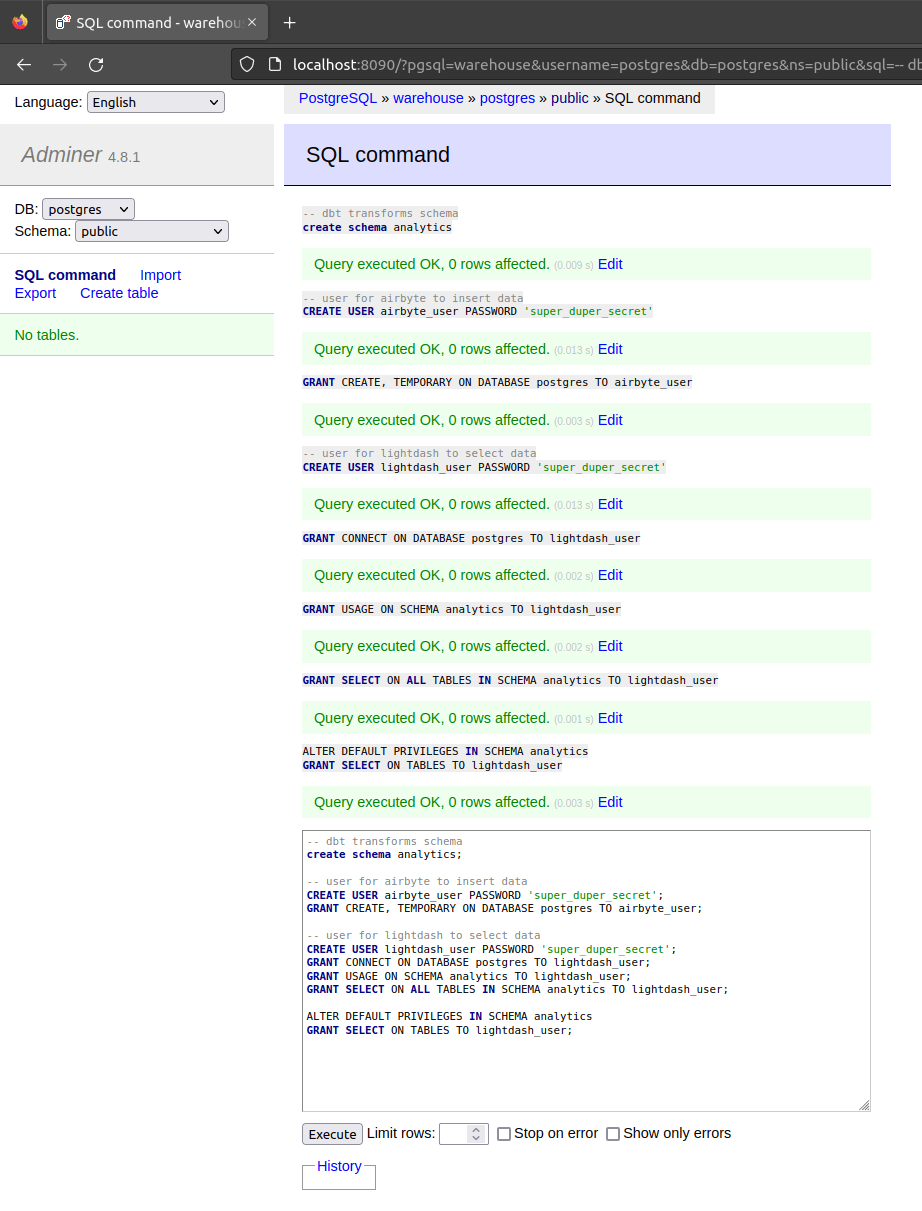
Now the database if ready! Let’s get to getting data into our database with Airbyte.
Fetch data with Airbyte
Enter the airbyte folder folder and run
docker-compose up
Then open localhost:8000 in the web browser. It takes a little while before Airbyte is ready and running. After a while you should see something like the following.
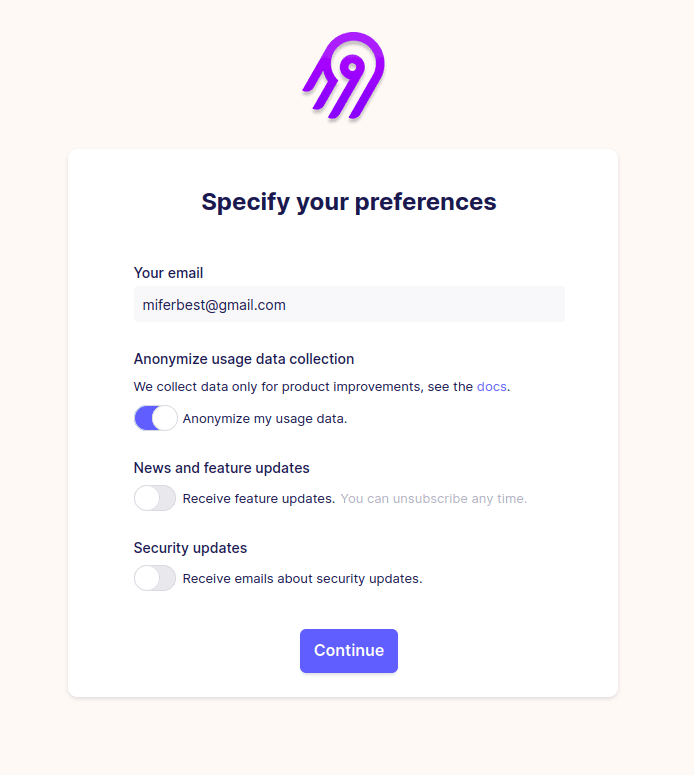
Add source connectors
After filling out and clicking continue, it is time to add some source connectors that parses the yahoo finance API. First click settings in the bottom left, then click Sources and then + New connector.
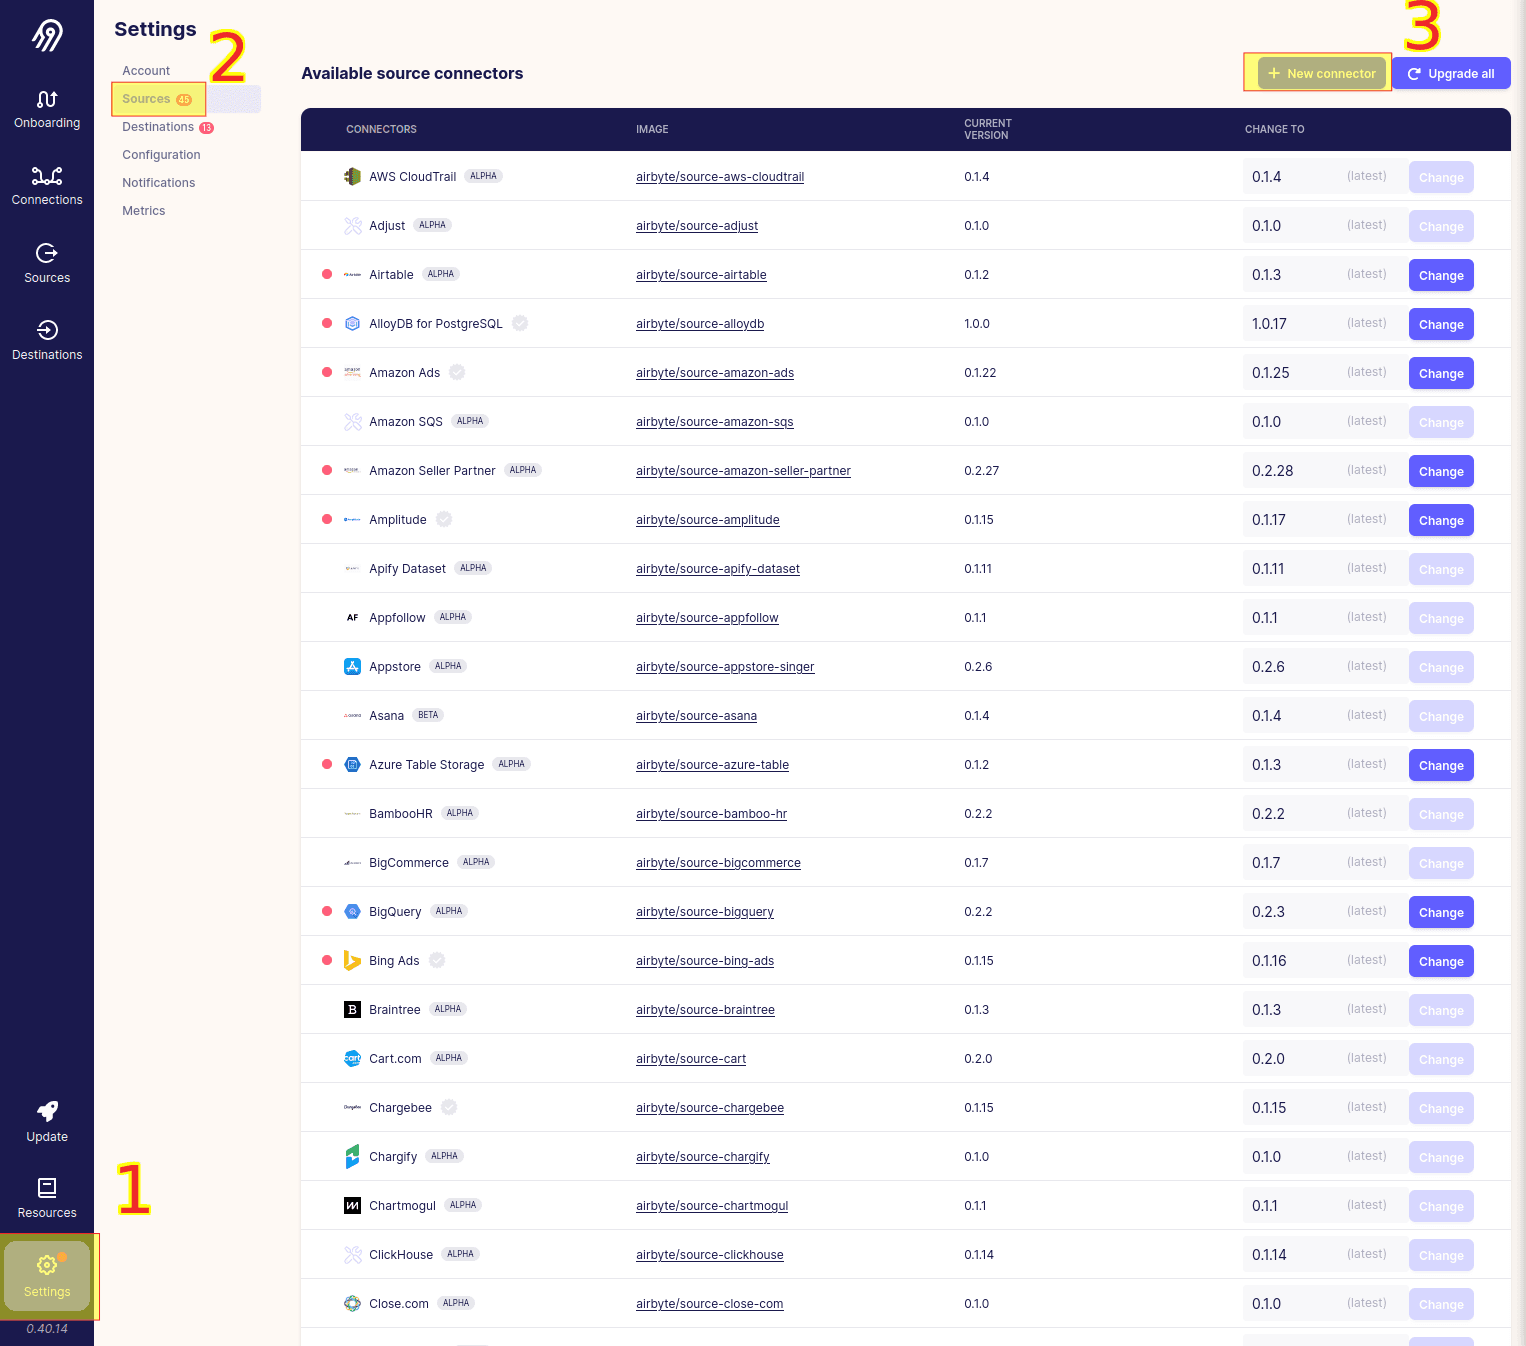
Fill in the following into the add new connector window.
- Connector display name: Yahoo Finance Financials
- Docker repository name: travbula/source-yahoo-finance-financials
- Docker image tag: 0.1.32
- Connector Documentation URL: https://travbula.no

Then click and Add. Click + New connector again to add the Yahoo Finance Price source.
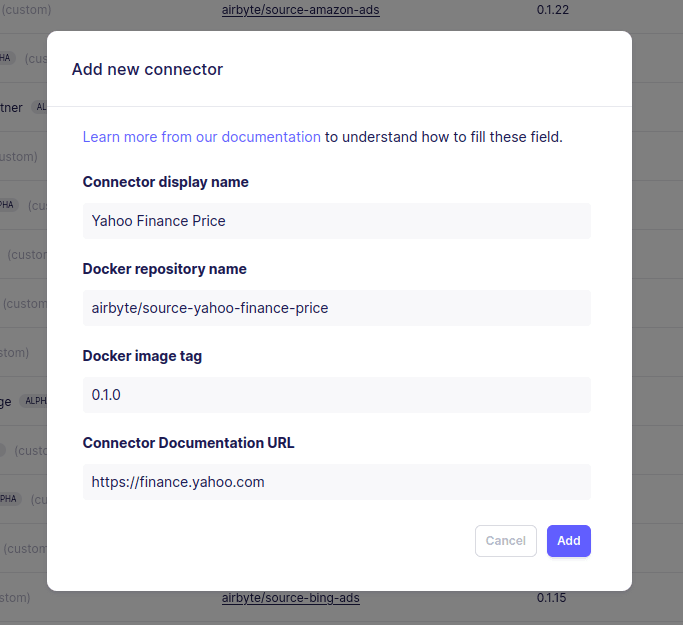
Now we have added the two source connectors we will utilize to get data from yahoo finance. The next step is to configure our destination, which is where we will store the data.
Add warehouse destination
In this section we add the destination for the data. This is a simple step, as we utilize a destination component already incorporated into Airbyte.
First, click Destinations.
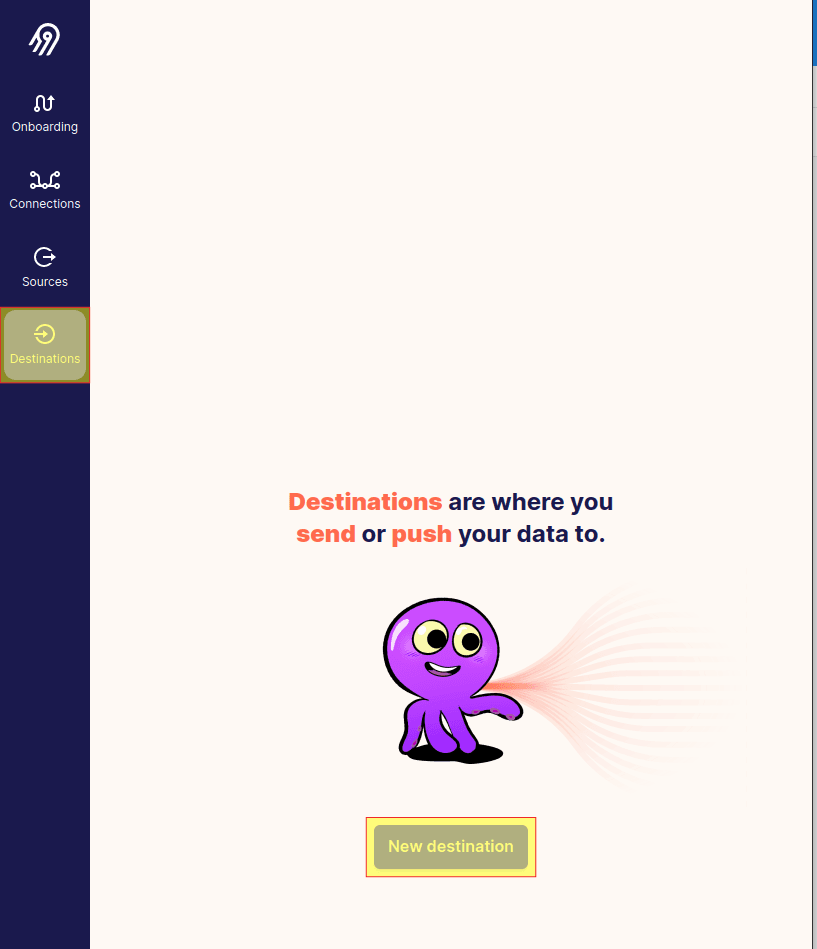
Then click New distination and choose Postgres.
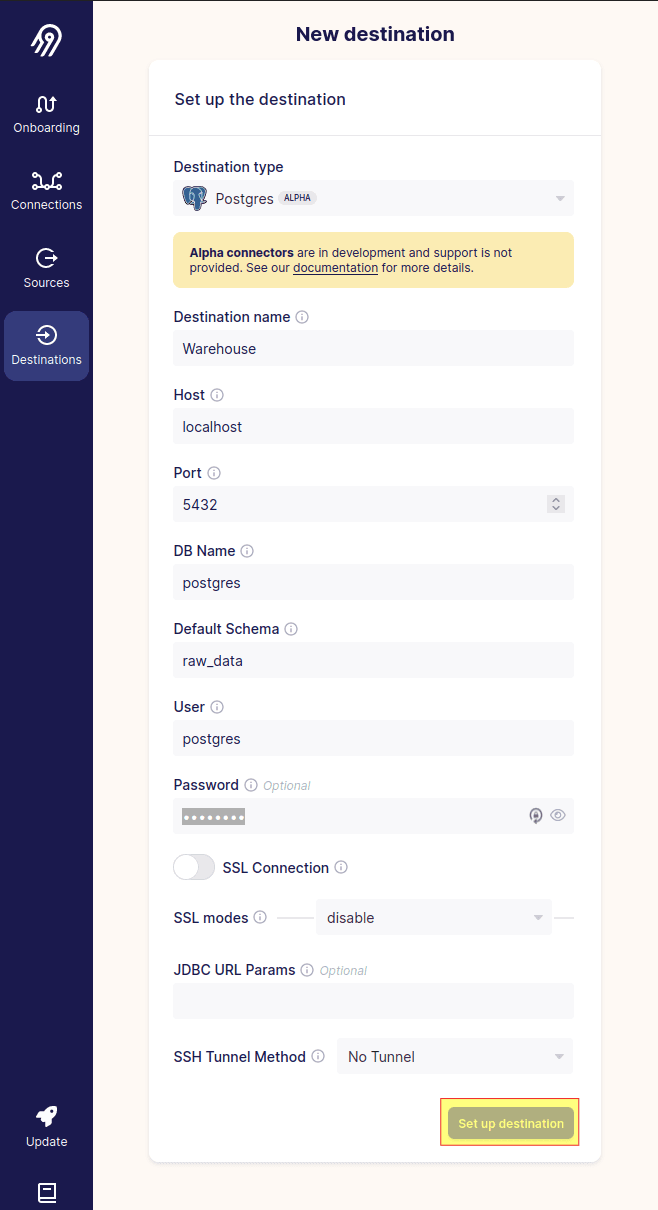
After picking Postgres, fill in the info as above. You could also use the airbyte_user with the ‘super_duper_secret’ password.
Next up we add our sources.
Add sources
A source is where we get our data from. We will set up one source for financial data and one source for stock price data.
First, click sources and look for Yahoo Finance Financials.

Fill in any tickers you’d like into the tickers box. Note that you might have to tab out of the box for each ticker to let Airbyte know they are not the same ticker. Also, the tickers must exist on finance.yahoo.com. Sometimes the naming on yahoo finance is different from your stock exchange’s ticker naming (as in SDSD.OL instead of SDSD).
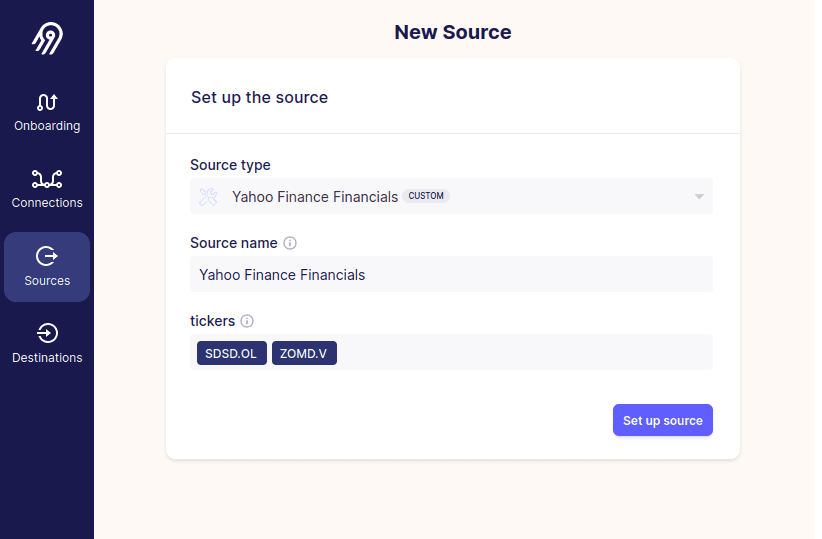
Click set up source. Next we will connect the source to our destination. Simply click add destination and then Warehouse.
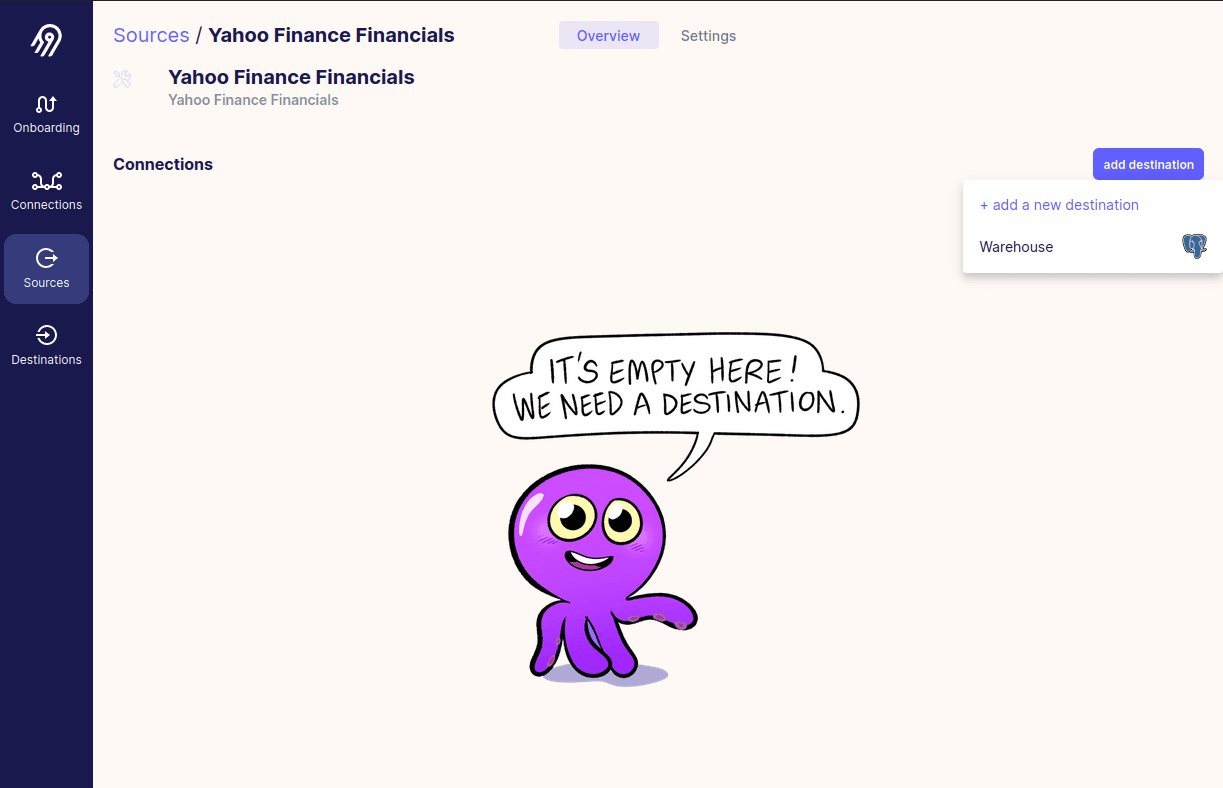
Now you will get a configuration screen for the connection. The most important part is to turn off “Normalized tabular data” at the bottom as this will make the sync fail. I also suggest setting replication frequency to manual.
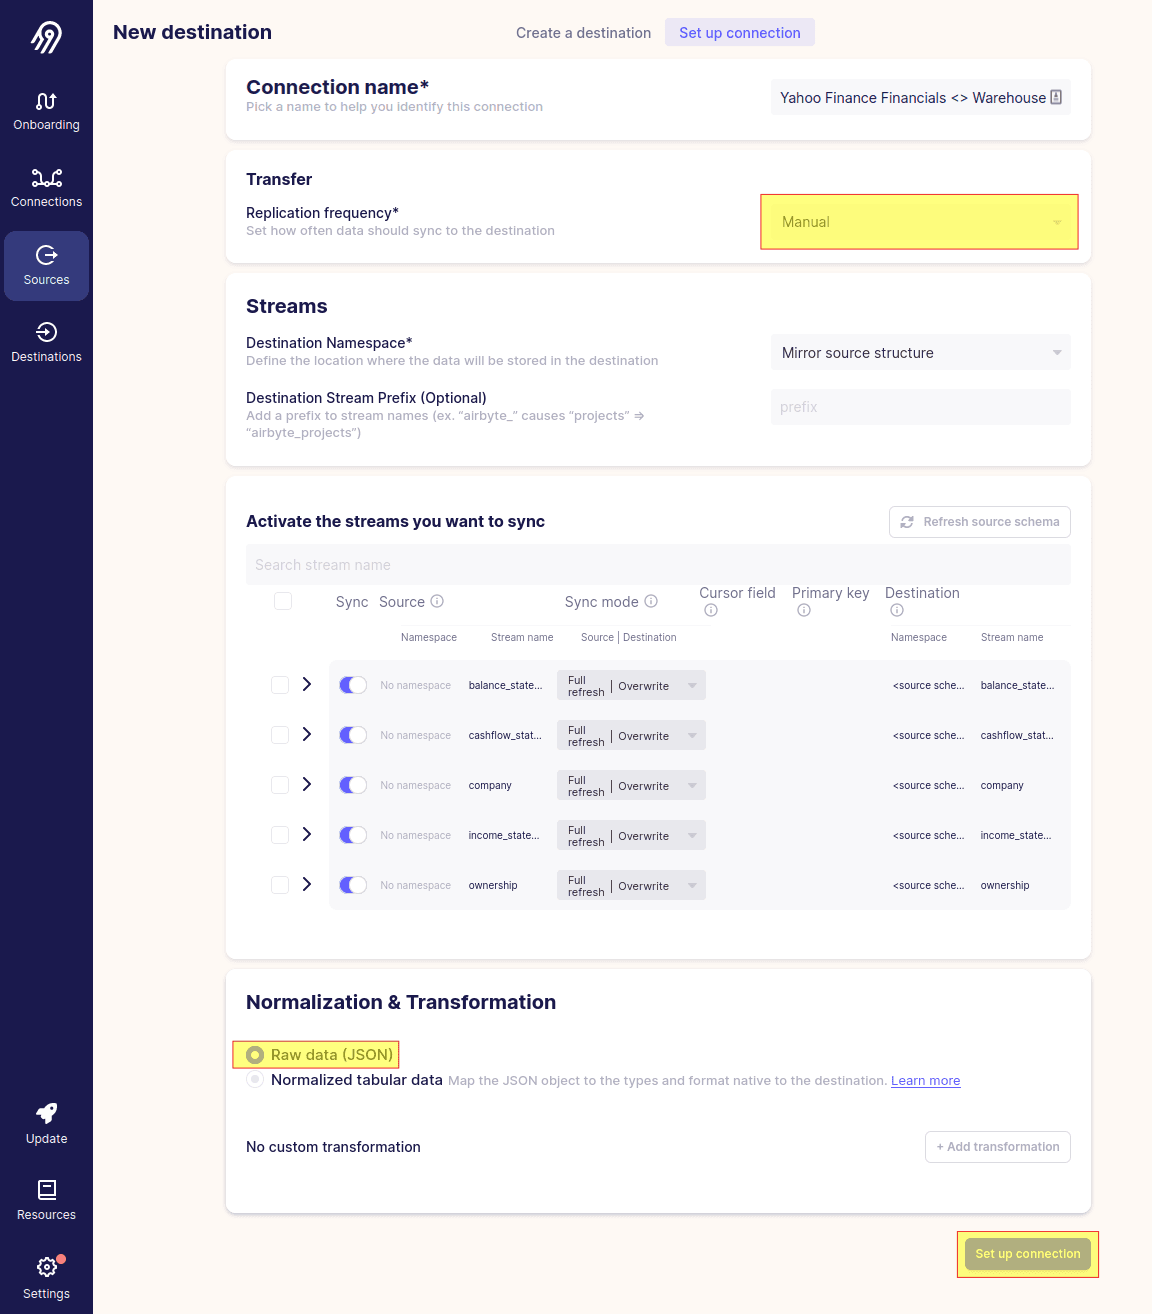
Click set up connection and then sync now in the next window.
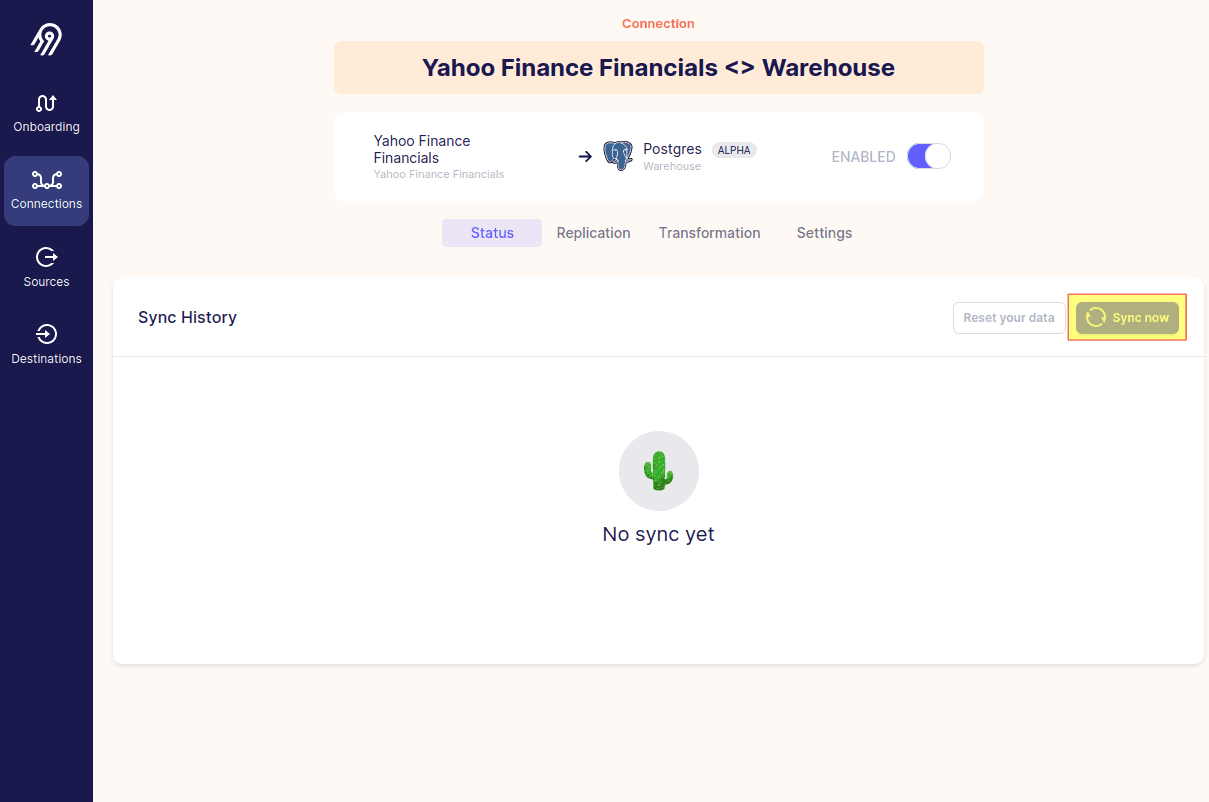
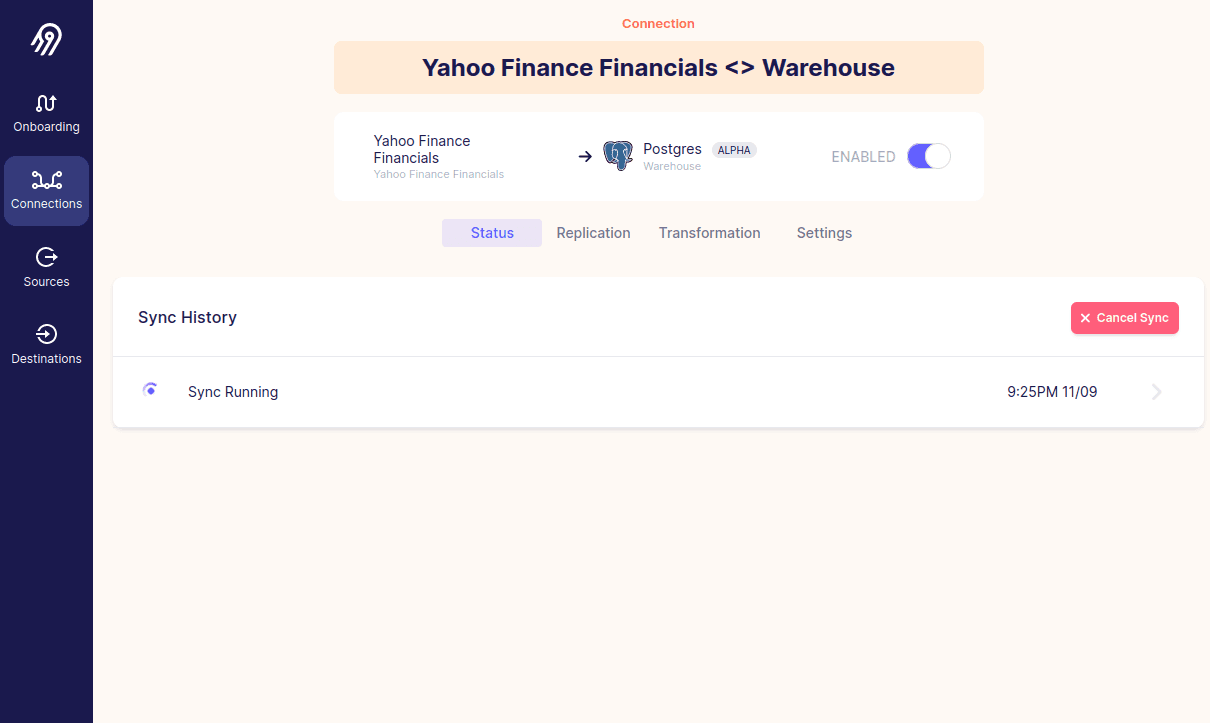
The sync should start running.
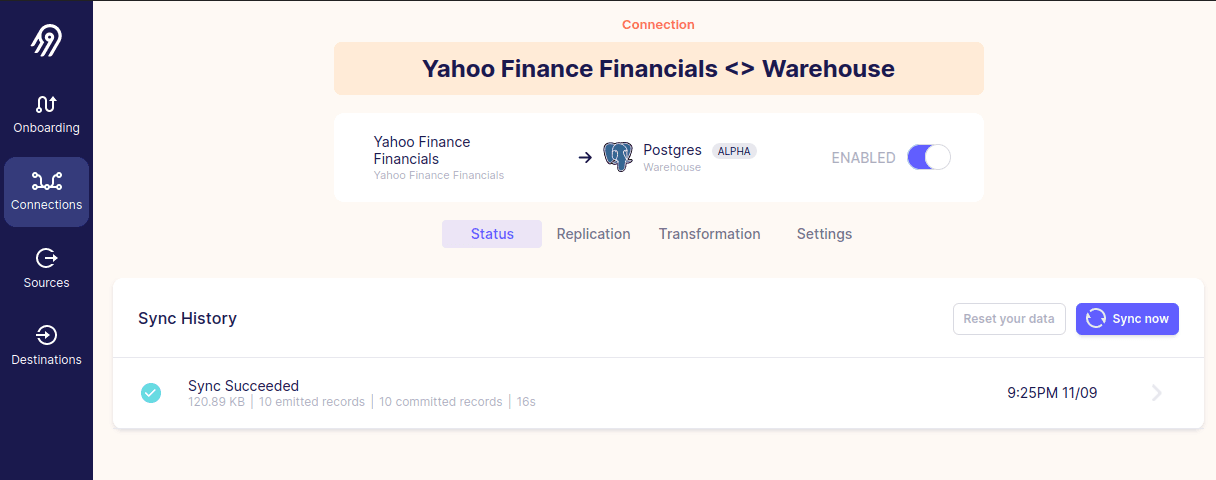
If you get sync succeeded, you should now have successfully transferred the data from the yahoo finance api into your database.
The next step is to follow the same process for a source for the stock prices. Use the Yahoo Finance Price source connector for this. The image below contains a suggestion for the source configuration.
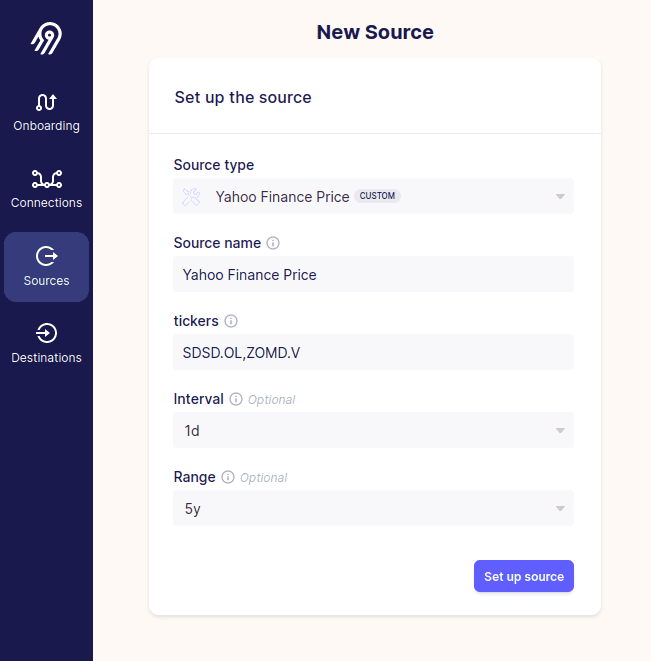
After setting up and syncing the price data, we are now ready to make the raw data analyzable with models made in dbt.
Model the data inside of the warehouse with dbt
In this section we will take the raw data from above and make them ready for visualization in a BI tool like Lightdash.
First up is to set up dbt.
Setup dbt
Open the dbt-model folder.
Create a python virtual environment.
python3 -m venv .venv
Activate environment.
source .venv/bin/activate
Install packages.
python -m pip install
Check your connection.
dbt debug --profiles-dir=.
Tips: if you’d like to skip --profiles-dir=. each time, copy the profiles.yml file into ~/dbt/.
Install dbt packages.
dbt deps
Run dbt
dbt run
If this was successful, your datawarehouse should have a bunch of views in the analytics schema. The most interesting views are those in the dbt-model/models/marts/ folder:
dim_companydim_currencyfact_balance_statementfact_free_cashflowfact_income_statementfact_stock_pricelatest_market_capitalizationlatest_stock_price_in_yearmarket_capitalization
See more information about these in the documentation generated in the next step.
Browse the documentation
Generate documentation of the dbt stuff
dbt docs generate
Start a web server that hosts the documentation
dbt docs serve --port 9000
Open the documentation in your web browser at localhost:9000.
dbt development with vscode
This is a bit unrelated to everything else, but there are two nice dbt extensions in VSCode called “dbt Power User” and “dbt formatter”.
Visualize data with Lightdash
Enter lightdash folder and run
docker-compose --env-file ./.env.fast-install -f docker-compose.yml up --detach --remove-orphans || true
Open http://localhost:8080.
Then follow the images below (todo: write descriptions).
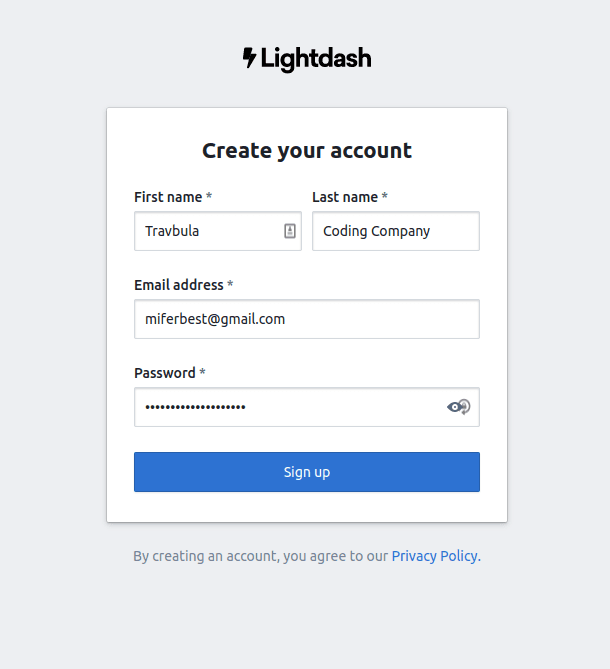
Create an account.
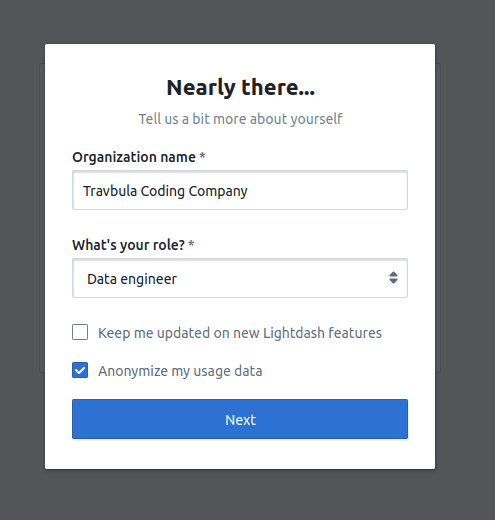
The organization name becomes the name of the whole Lightdash project or something like that. Not so important.
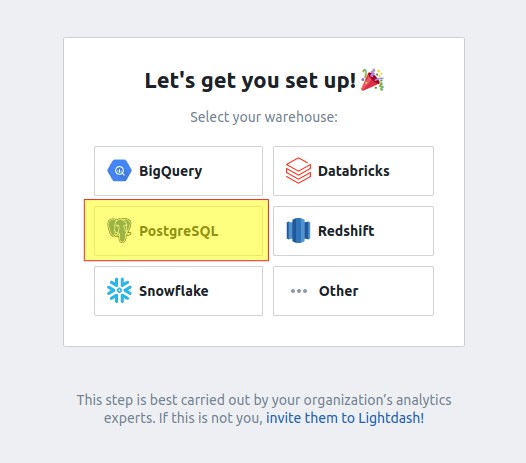
Choose PostgreSQL warehouse.
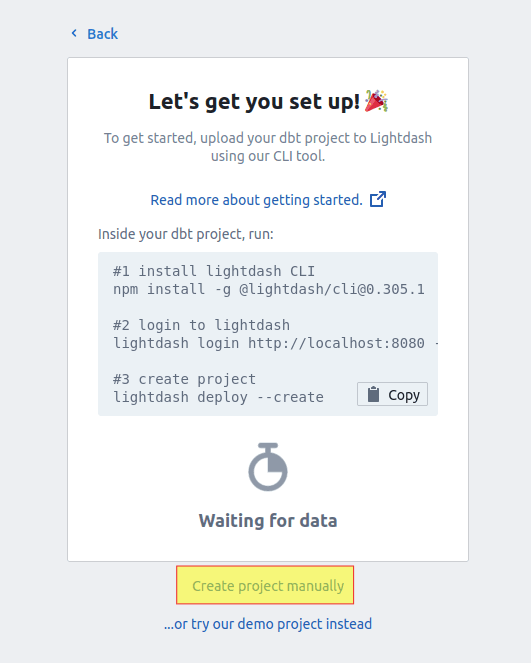
Click create project manually. (Feel free to use the Lightdash install tool if you’d like to instead.)
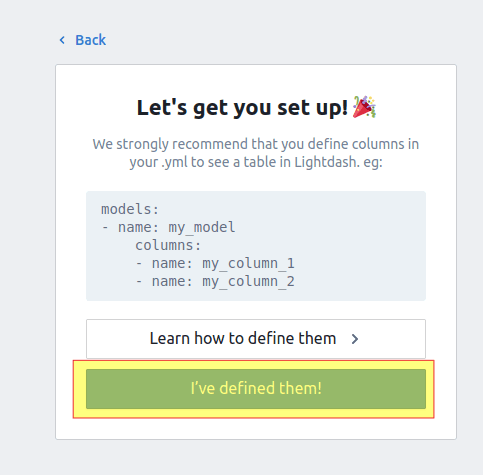
We have already defined some metrics, so click I’ve defined them.
The next two images contains the connection info to the database and the info of the dbt project.
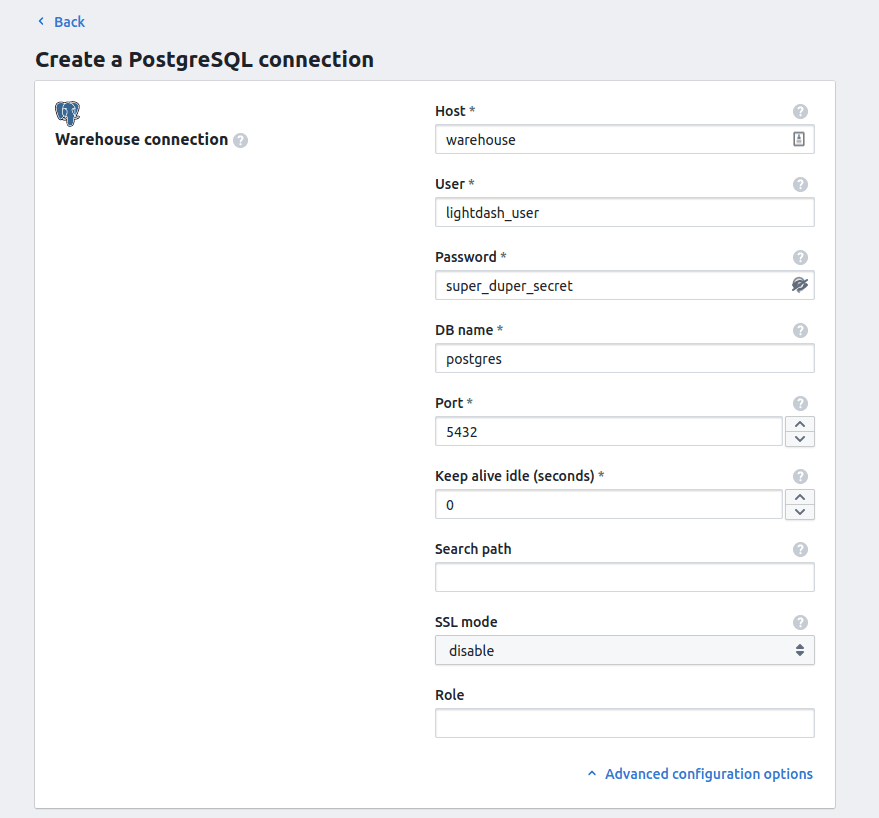
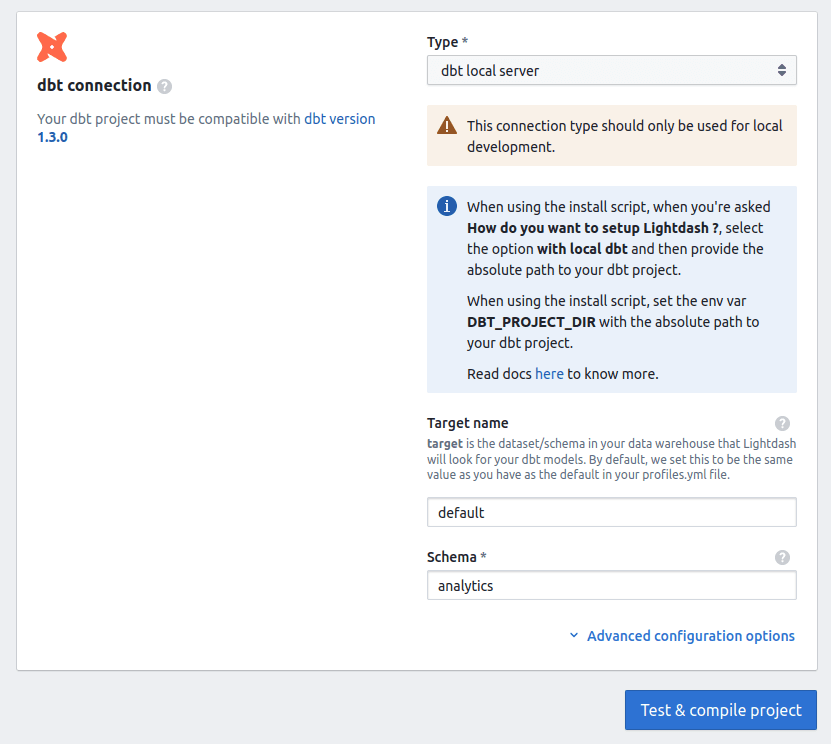
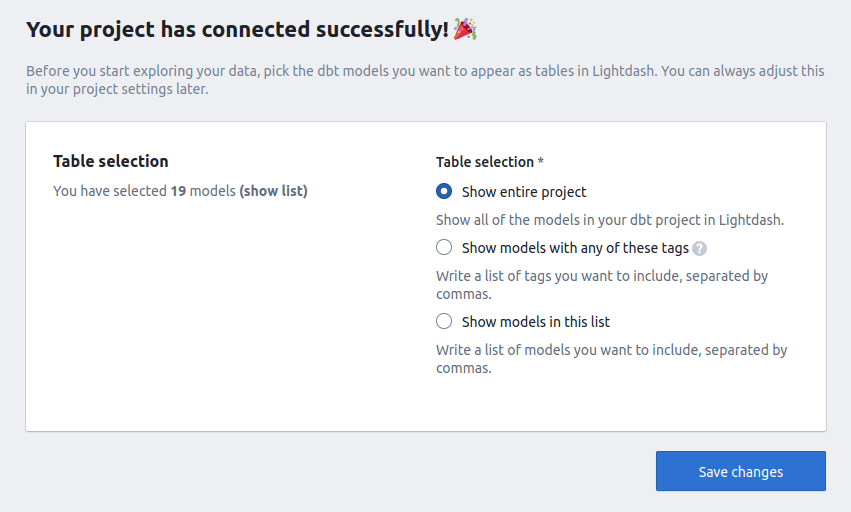
Hopefully you get the successful connection message after clicking test & compile project.
Choose show entire project and click save changes.
Then in the top left click explore and then tables.
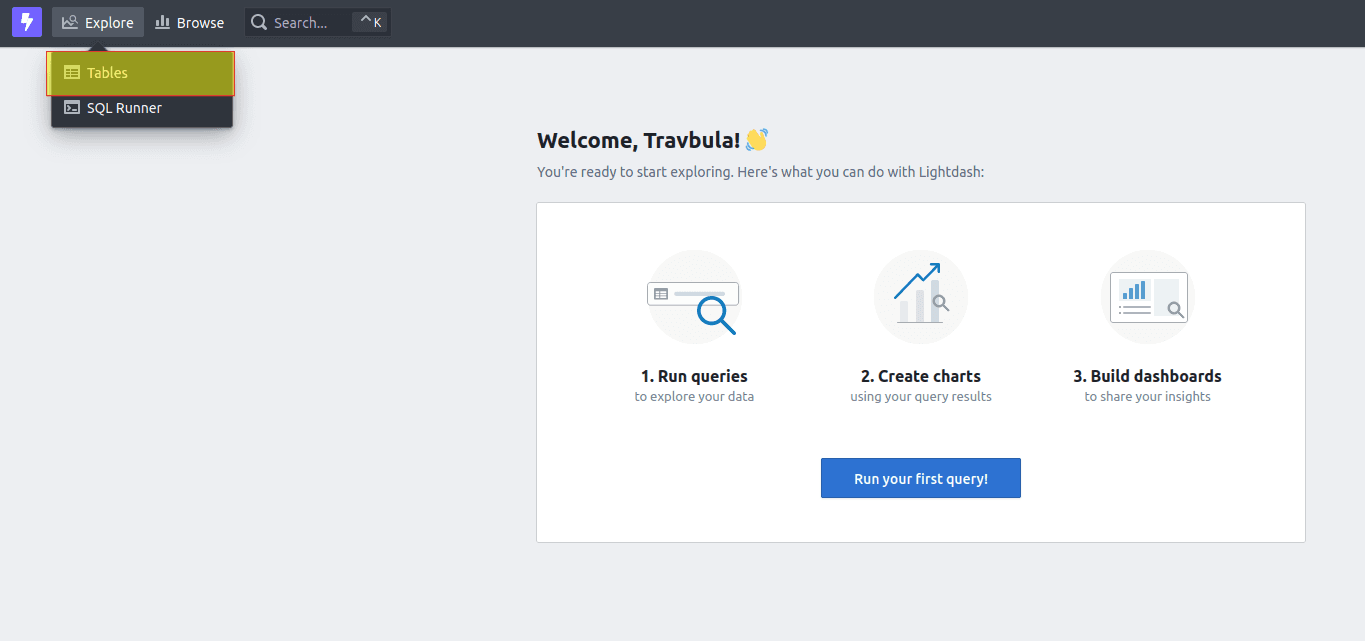
In the left menu of the screen you will see all of the available tables. Click Market capitalization.
Now you will see all of the available dimensions in the Market capitalization table and all of the metrics.
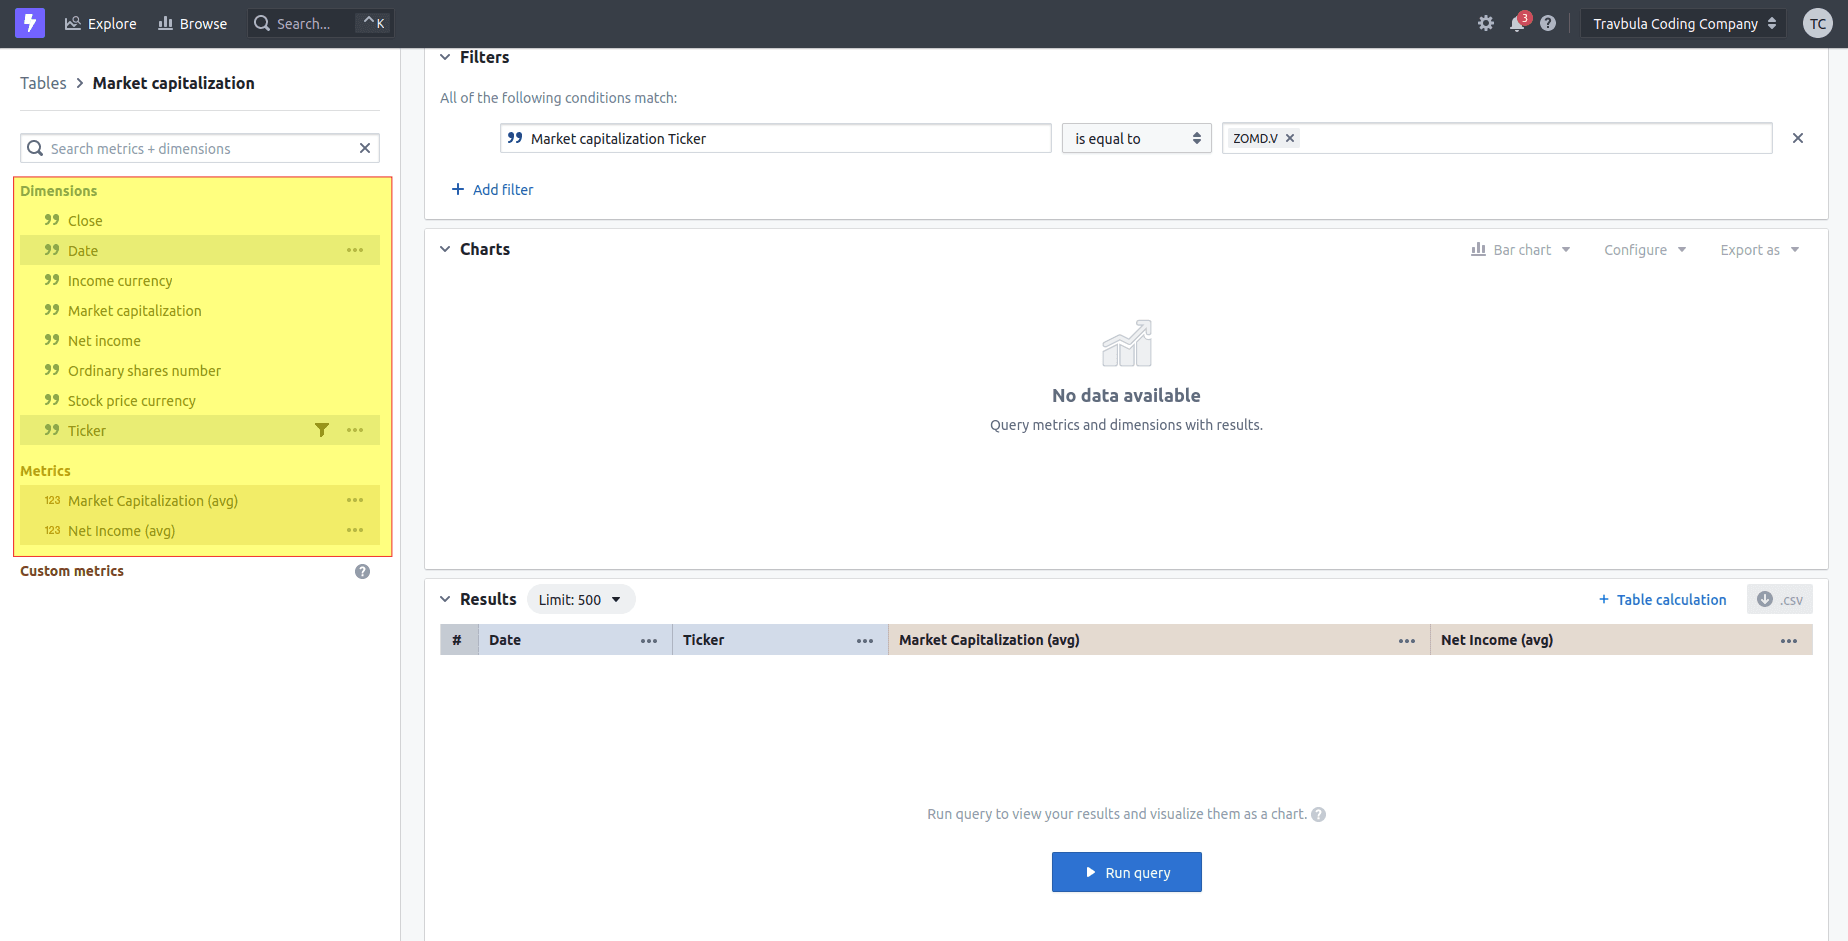
Choose the dimensions date and ticker, and the metrics Market capitalization (avg) and Net income (avg) by clicking on them in the left menu. Note that the avg naming is in this case a bit weird as we will set up our visualization such that they are an average of one data point.
After choosing the dimensions and metrics, click Run query.
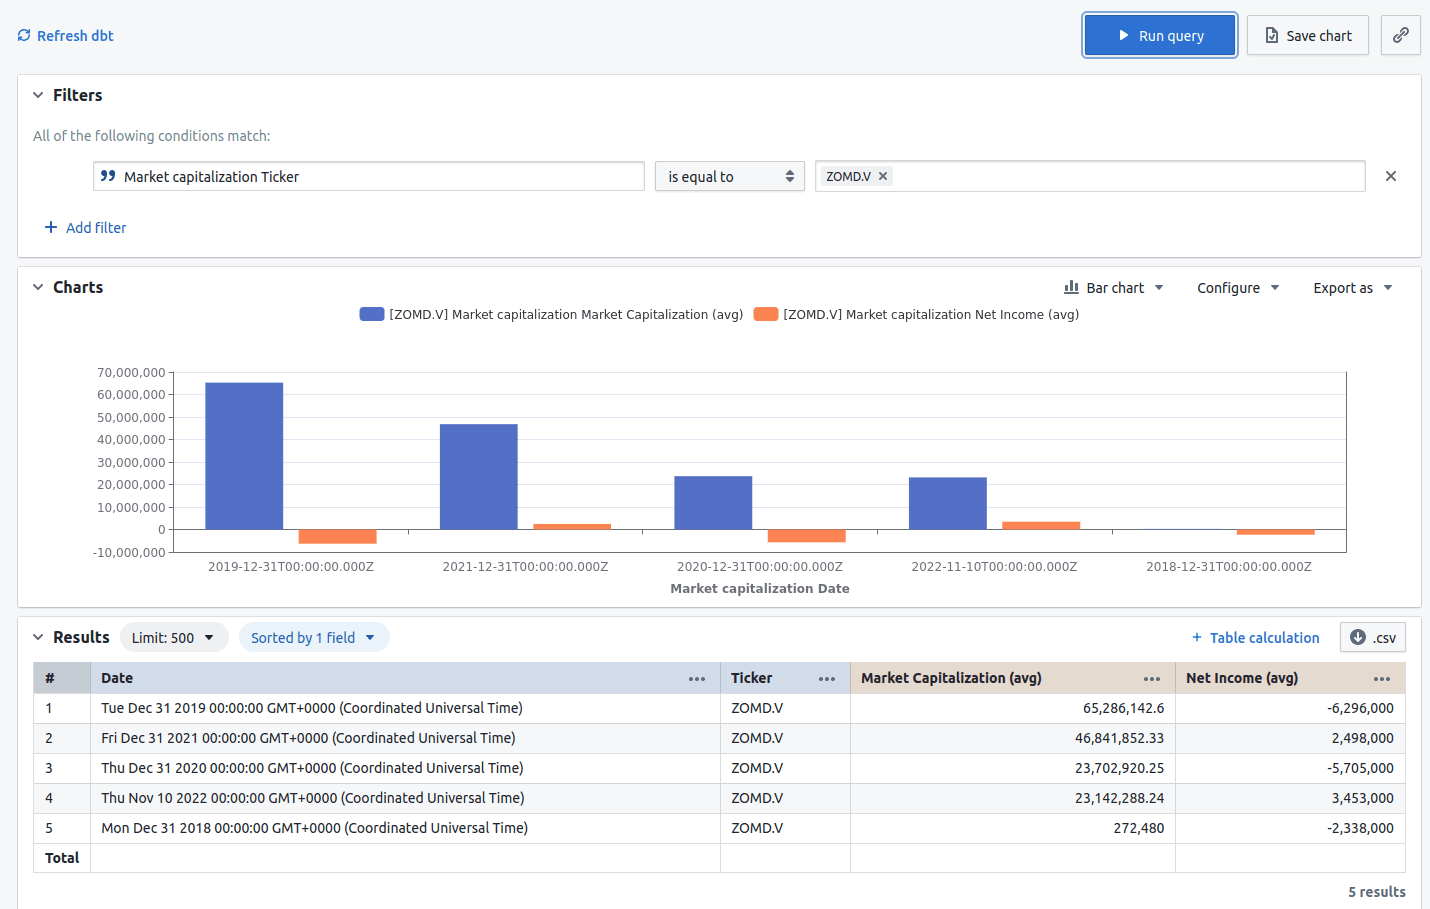
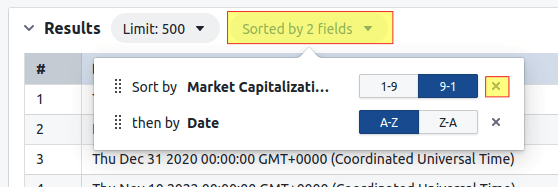
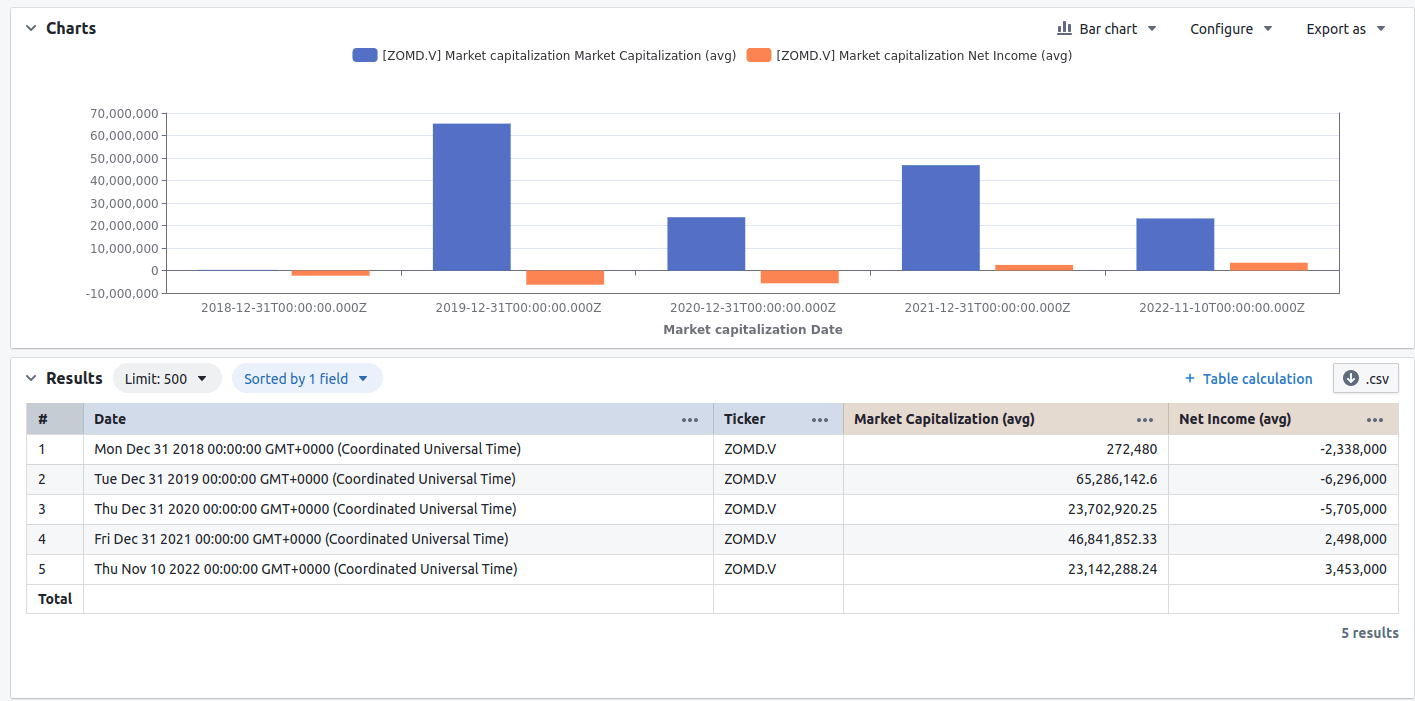
Now you should see some stuff under Charts. For me, the x-axis was sorted by market cap instead of date. To fix this, add sorting by date by clicking the three dots to the right of the Date label and click Sort A-Z.

Then remove sorting by market capi by clicking the Sorted by 2 fields thing and clicking the x to the right of sort by market cap.
Now the chart should make a bit more sense!
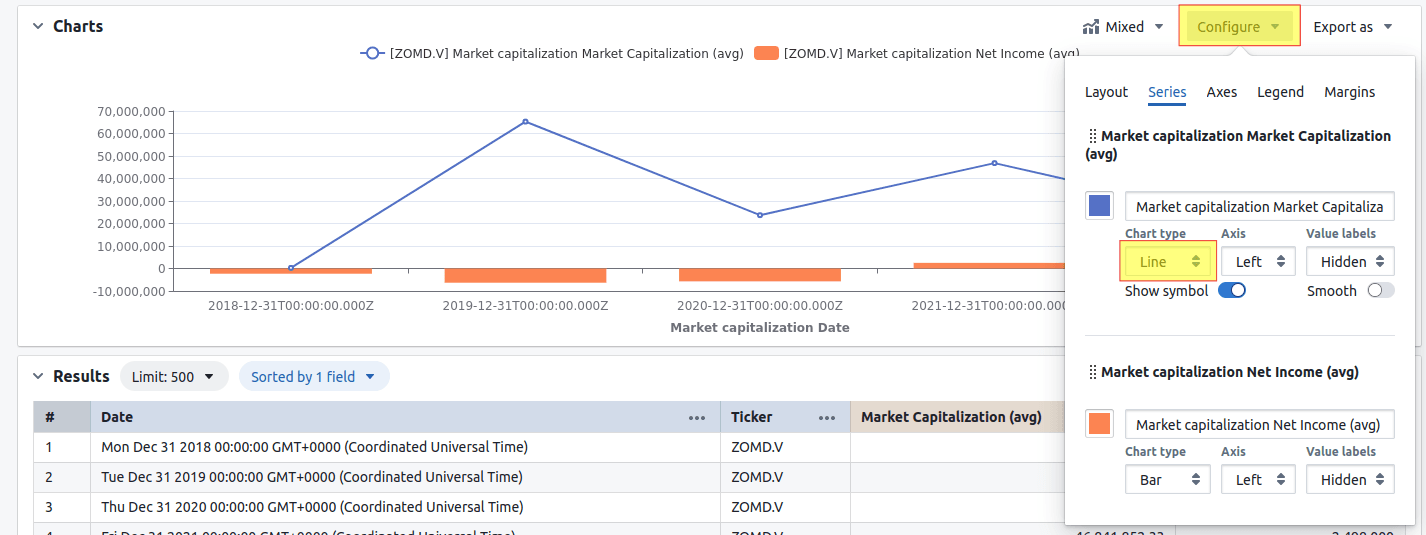
If you’d like to, you can play around with how the data is visualized, e.g. by having the market cap visualized by a line.

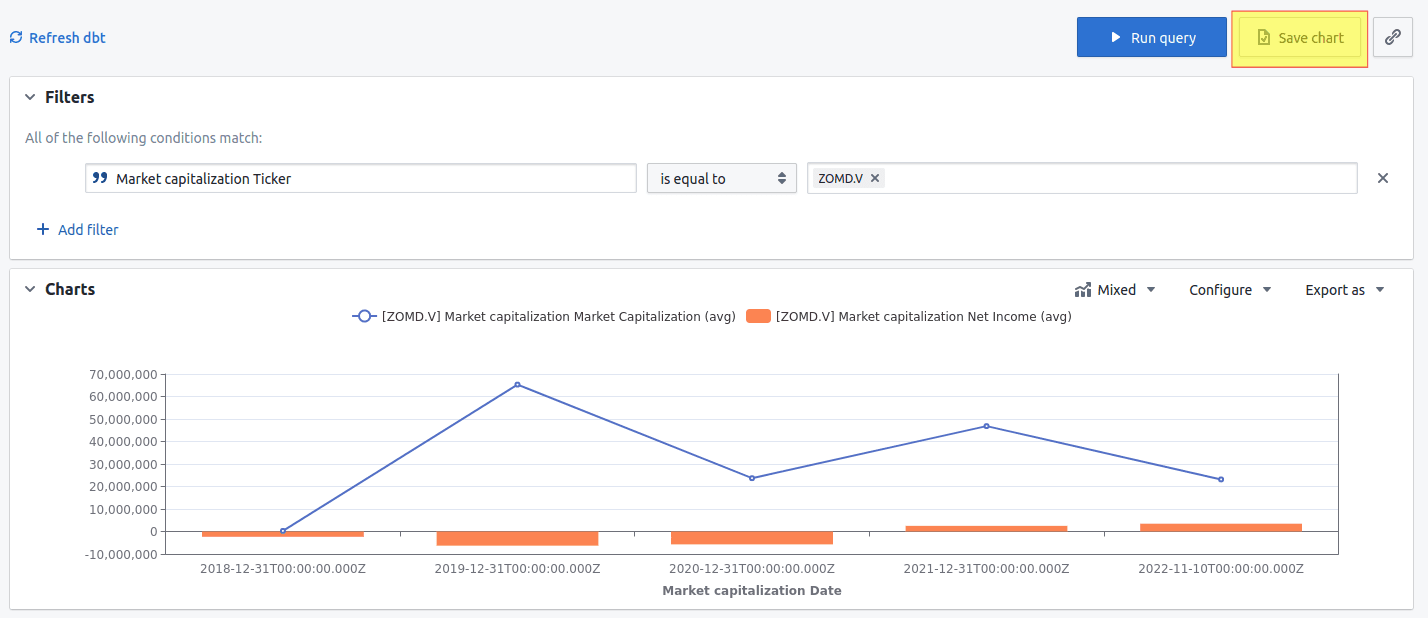
You can save the chart, which lets you add it to a dashboard later.
If you’ve come this far, congratulations! Not only have you set up your own data warehouse with data from yahoo finance, you’ve also managed to read through a long and way too boring how-to article. Further, you’ve used data inside of your warehouse to visualize something meaningful in a BI tool.
As a bonus for soldiering through the post, especially for my Norwegian friends supporting Strømsgodset, I’ll include a chat log with ChatGPT that displays how smart and full of wisdom it can be when given proper instructions:
